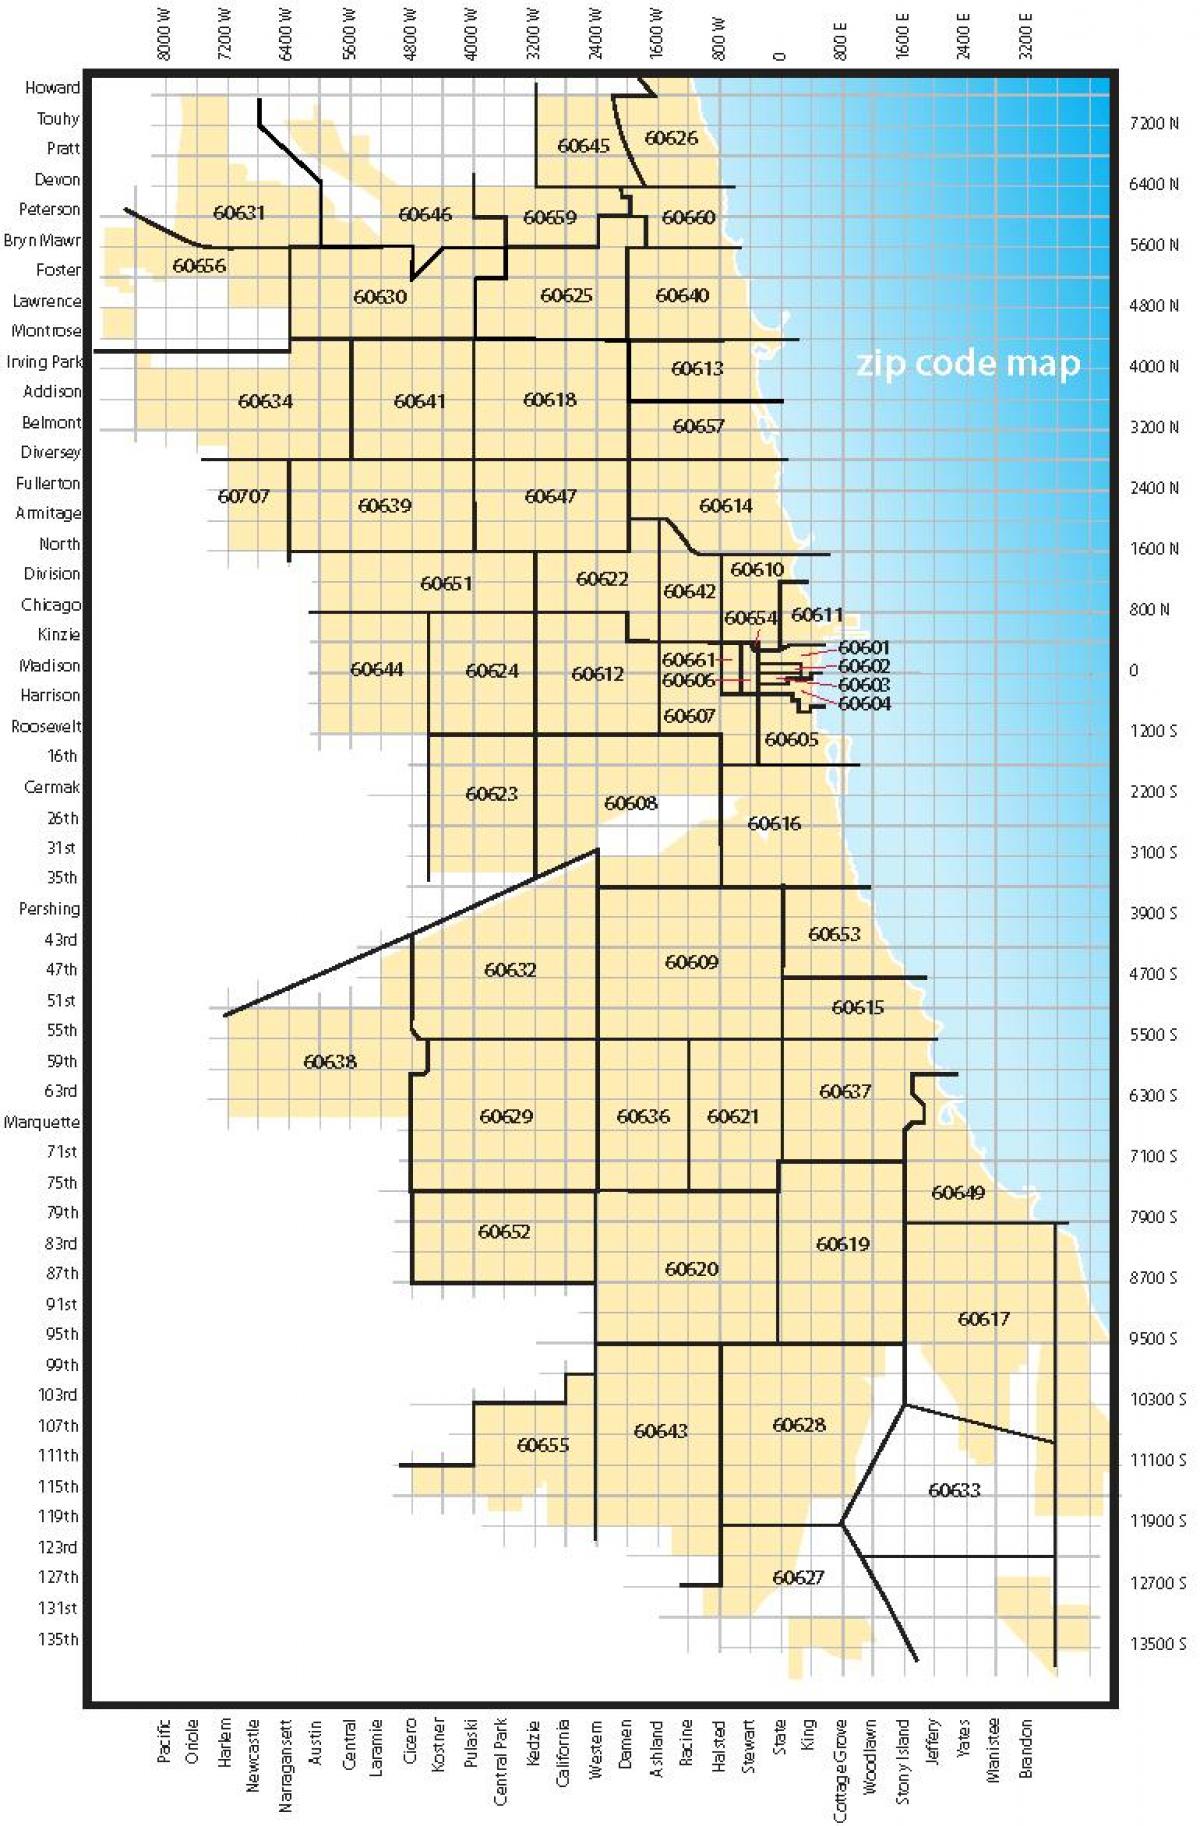
I’ve been analyzing Chicago’s nonprofit formation data — all 4,212 organizations formed across the city’s 56 ZIP codes between 2021 and 2025, drawn directly from the IRS Exempt Organizations Business Master File and cross-referenced with U.S. Census demographic data.
What the numbers reveal isn’t one Chicago nonprofit ecosystem. It’s four — each forming at a different pace, shaped by different community histories, and carrying a different relationship to the nonprofit infrastructure that already exists.
If you’re thinking about starting a nonprofit, understanding which ecosystem you’re building into matters.
A note on what this data can and cannot tell us. The IRS formation data tells us where and when nonprofits receive tax-exempt status. It does not tell us who founded them, why, or what kind of organizations they are. The demographic data from the U.S. Census tells us who lives in those ZIP codes — income, population, racial composition. Where I offer observations about what founders in these communities typically need, I’m drawing on my own professional experience working with nonprofit founders, not on anything the data proves.
Cluster One: The Professional Corridor
ZIP codes60601, 60602, 60603, 60604, 60605, 60606, 60607, 60610, 60611, 60654, 60661NeighborhoodsThe Loop, West Loop, River North, Near North, South Loop
What the data shows
This cluster produced 960 new nonprofits between 2021 and 2025 — about 22.8% of all Chicago formations. Year-over-year, formations grew from 151 in 2021 to 190–213 per year in 2023–2024, then pulled back slightly to 190 in 2025.
The leading ZIPs are 60607 (155 formations), 60606 (152), and 60611 (148).
These are Chicago’s highest-income ZIP codes. Median household incomes range from $94,000 to $139,000 (U.S. Census ACS 2020–2024). The populations are majority White (51–62%) with significant Asian representation (18–23%). Labor force participation rates exceed 90%.
The cluster carries an enormous pre-2000 nonprofit baseline — 3,145 organizations formed before 2000, the largest historic base of any cluster in the city. That means the recent velocity ratio is just 0.31x: the cluster is currently forming nonprofits at about 31% of its own historic pace — reflecting not decline but the weight of an already dense and mature ecosystem.
One important caveat on downtown ZIPs like 60603, 60604, and 60606: these are primarily commercial and office districts with very small residential populations. Organizations formed here may use professional addresses — law firms, accountants, registered agents — rather than reflecting community-based formation.
From my experience
The founders I work with from these communities tend to come in with significant organizational experience — board service, financial management, strategic planning. What they often underestimate is how different the internal reality of nonprofit operations is from the boardroom view: the IRS compliance rhythms, the particular culture of the philanthropic funding world, and the governance demands of actually running an organization rather than overseeing one.
Cluster Two: The South Side Community Belt
ZIP codes60615, 60617, 60619, 60620, 60628, 60637, 60643, 60649, 60653NeighborhoodsChatham, Roseland, Auburn Gresham, Morgan Park, Hyde Park, South Shore, Bronzeville, South Chicago
What the data shows
This is the highest-volume cluster in the city, producing 1,130 new nonprofits between 2021 and 2025 — 26.8% of all Chicago formations. It is the only cluster where formations in 2024 surpassed 300 in a single year.
60619 (Chatham/Greater Grand Crossing) produced 170 formations — the single highest count of any ZIP code in Chicago. That’s more than the Loop (60606: 152), more than River North (60611: 148), more than any ZIP code in any other cluster.
Who is behind the number
Each of those 170 formations is a person who decided that the needs of her community were worth organizing around.
Research tells us something about who that person likely is. Women lead 62% of the smallest nonprofits — those with expenses under $50,000 — according to Candid’s State of Diversity in the U.S. Nonprofit Sector, a study drawing on demographic data from 59,550 public charities. The same report notes that BIPOC women may disproportionately lead the smallest organizations not because they are hired into those roles, but because they are founding their own — “consistent with other research that suggests that women, and especially women of color, are increasingly opting out of systems that are not working for — and are often actively discriminating against — them.” Nonprofit directors as a group skew 40 and older, with 89% falling in that range according to workforce data. In my own work with community-based founders, she is also often working at least one other job.
She filled out paperwork. She recruited volunteers. She opened a bank account in the name of something larger than herself.
And then, in most cases, she ran into the same wall.
That wall has a name. A 2020 study by Echoing Green and the Bridgespan Group — analyzing funding data from one of the nonprofit sector’s most competitive fellowship programs — found that organizations led by Black women are funded at lower levels than those led by Black men or white women. The unrestricted assets of organizations led by people of color are, on average, 76% smaller than those led by white leaders. Leaders of color in the study reported being locked out of the social networks that connect founders to funders, facing interpersonal bias in relationship-building with foundation staff, and struggling to sustain funding relationships once formed.
She built something real. The sector treated it as a risk.
The top five ZIPs in this cluster: 60619 (170), 60628 (145), 60643 (141), 60620 (132), 60637 (117).
The cluster’s velocity ratio is 0.59x — forming at 59% of its pre-2000 pace — but the decade trend tells a more interesting story: 444 formations in 2000–2009, 981 in 2010–2020, and 1,130 in 2021–2025 alone. Formation is accelerating significantly decade over decade.
These ZIP codes span a range of income levels. Morgan Park/Beverly (60643) has a median household income of $83,015. Chatham (60619) is at $43,403. Roseland (60628) at $49,719. Auburn Gresham (60620) at $48,805. (U.S. Census ACS 2020–2024, Table DP03.)
Demographically, seven of the nine ZIP codes in this cluster are majority Black/African American, ranging from 65% to 96%.
From my experience
The founders I work with from these communities often have deep roots in the problems they’re trying to solve. What I consistently see is that the formalization step — converting years of community work into a sustainable legal structure — creates a specific set of operational challenges: financial systems that can function without professional staff, governance structures that work at an early stage, and a funding strategy that doesn’t assume an established track record.
Cluster Three: The West Side
ZIP codes60608, 60612, 60623, 60624, 60639, 60644, 60651NeighborhoodsPilsen, East Garfield Park, North Lawndale, West Garfield Park, Austin, Belmont Cragin, Humboldt Park
What the data shows
The West Side produced 561 new nonprofits between 2021 and 2025 — 13.3% of Chicago’s total. That’s the smallest share of the four clusters by absolute count. But the velocity story is the most striking in the entire dataset.
This cluster has a velocity ratio of 1.05x — meaning it is currently forming nonprofits at a pace that exceeds its own pre-2000 baseline. It is the only cluster in the city doing so. Every other cluster is forming below its own historical pace; the West Side is forming above it.
Within the cluster, two ZIP codes show especially strong velocity:
- 60644 (Austin): 1.47x — 87 recent formations against a pre-2000 base of 59
- 60624 (West Garfield Park): 1.44x — 75 recent formations against a pre-2000 base of 52
- 60612 (East Garfield Park/Medical District): 1.06x — 122 formations, the cluster’s highest absolute count, making it the 8th highest-producing ZIP in all of Chicago
The year-over-year trend shows clear acceleration: 92 formations in 2021, growing to 158 in 2025 — a 72% increase over the period.
What makes this notable is the context these ZIP codes carry. According to U.S. Census data, median household incomes across this cluster range from $42,318 (60644/Austin) to $68,945 (60616/Pilsen). The cluster is majority Black and Hispanic. And it has absorbed documented, severe population loss over the past several decades — North Lawndale alone lost more than 70% of its total population between the 1960s and 2000s according to U.S. Census records, a pattern documented across multiple West Side community areas.
The cluster also carries the largest legacy nonprofit infrastructure outside of downtown. Organizations like Bethel New Life, the North Lawndale Employment Network, and the Lawndale Christian Development Corporation have operated here for decades. The pre-2000 baseline of 532 organizations reflects that institutional density.
What we do not know from the data is who is driving the current formation surge or why it is accelerating now. The IRS data cannot tell us that. What the data establishes is that the West Side is currently the highest-velocity formation cluster in Chicago — surpassing its own history at a moment when every other cluster is below its historical pace.
From my experience
I don’t have enough direct data about West Side founders specifically to characterize them as a group. What I can say from my broader experience is that communities with strong existing nonprofit infrastructure often produce founders who have worked inside that infrastructure — and that making the shift from employed practitioner to independent founder creates a distinct set of challenges that are worth being honest about before you start.
Cluster Four: The North Side
ZIP codes60613, 60614, 60618, 60622, 60625, 60626, 60630, 60631, 60634, 60640, 60641, 60645, 60646, 60647, 60657, 60659, 60660NeighborhoodsLakeview, Lincoln Park, Uptown, Logan Square, Wicker Park, Rogers Park, West Ridge, Lincoln Square, Roscoe Village, Jefferson Park, Norwood Park, Portage Park, Edgewater
What the data shows
The North Side is not a quiet cluster — it produced 1,047 new nonprofits between 2021 and 2025, the second-highest total of any cluster in the city. And year-over-year, it shows the sharpest raw growth: from 132 formations in 2021 to 277 in 2025, more than doubling in four years.
The overall velocity ratio is 0.75x — forming at 75% of its pre-2000 pace. But that aggregate number conceals significant internal variation.
Within the North Side, the highest-velocity ZIP codes are not the wealthy or well-known ones:
| ZIP | Neighborhood | 2021–2025 | Pre-2000 | Velocity |
|---|---|---|---|---|
| 60645 | West Ridge | 71 | 54 | 1.31x |
| 60659 | West Ridge / North Park | 76 | 68 | 1.12x |
| 60618 | North Center / Roscoe Village | 96 | 89 | 1.08x |
| 60622 | Wicker Park / Ukrainian Village | 65 | 60 | 1.08x |
60645 and 60659, which together cover West Ridge and the surrounding area, are the fastest-growing ZIP codes on the entire North Side — and are forming above their own historical pace, just as the West Side’s leading ZIPs are. According to U.S. Census data, West Ridge (60645) is one of Chicago’s most ethnically diverse ZIP codes, with large South Asian, Pakistani, Assyrian, and Middle Eastern populations alongside established Jewish and Orthodox communities.
At the other end of the velocity spectrum are the far Northwest Side ZIPs:
- 60631 (Edison Park): 0.34x — 37 formations against a pre-2000 base of 109
- 60646 (Norwood Park): 0.23x — 28 formations against a pre-2000 base of 120
- 60625 (Lincoln Square): 0.58x
- 60614 (Lincoln Park): 0.56x against a pre-2000 base of 151
These are some of the lowest-velocity ZIP codes in the entire city. Edison Park and Norwood Park are Chicago’s most suburban-feeling neighborhoods, with the lowest population densities, highest homeownership rates, and a pre-existing nonprofit base dominated by civic organizations and service clubs that is not being replaced at anything near its historical pace. Lincoln Park, despite being one of the wealthiest neighborhoods in Chicago (median income: $89,654), shows the same pattern — a large, mature legacy base and below-average current formation velocity.
The North Side demographic spread is wide: Median household incomes range from $65,432 in West Ridge (60645) to $98,234 in Lakeview (60657). The inner neighborhoods — Lakeview, Logan Square, Uptown, Wicker Park — are predominantly White with growing Hispanic populations in Logan Square and Humboldt Park. West Ridge is the most racially and ethnically diverse ZIP on the North Side. The far Northwest Side ZIP codes are predominantly White with lower income diversity.
From my experience
The North Side’s internal diversity means there isn’t a single founder profile here. What I observe is a wide range — from founders in the inner neighborhoods who look much like the Professional Corridor’s founder profile, to founders in Rogers Park and West Ridge who are navigating very different community contexts and organizing traditions. The data suggests the most active formation is happening in the most diverse communities on the North Side, which is consistent with what I see in my work.
What All Four Clusters Share
Four clusters. Four distinct formation stories. Different velocities, different demographics, different relationships to existing nonprofit infrastructure.
Here is where they converge: the legal and operational requirements of building a sustainable nonprofit are identical regardless of cluster.
The IRS does not issue a different 1023 form based on your ZIP code. The governance requirements for a new 501(c)(3) are the same in West Ridge and River North, in Chatham and Lincoln Park. The financial systems, the board structure, the compliance calendar, the funding fundamentals — none of these adapt themselves to context. Every new founder in every cluster has to build them from scratch.
In my work with nonprofit founders across Chicago and beyond, the challenges that end nonprofits in years one through three are remarkably consistent: legal formation done incorrectly, financial systems set up too late or not at all, boards that were recruited but never actually activated, and funding strategies built on assumptions rather than on how philanthropy actually works.
The knowledge to avoid those mistakes exists. For too long it was mostly accessible to organizations that could afford consultants. That’s the gap I built this work to close.
What I’m Doing About It
90 Days to a New Nonprofit is a step-by-step course for founders in all four clusters — and everywhere in between. In 90 days, you’ll move from idea to fully operational 501(c)(3) with the legal foundation, financial systems, board structure, and funding strategy your organization needs to last.
- Legal formation: incorporation, bylaws, IRS 1023 or 1023-EZ, and the decisions most founders get wrong
- Financial setup: development of organizational budget and 3 year projections and initial balance sheet
- Board development: how to build a board that actually helps you — not just signs documents
- Your first funding strategy: how to position a brand-new organization to attract grants and donors
- Operations: the systems that keep a small nonprofit from depending entirely on its founder to function
Course opens March 2, 2026
Join the Waitlist →
Which Cluster Is Yours?
The data tells us that 4,212 people across Chicago decided between 2021 and 2025 that a problem in their community was worth organizing around — and made it official. That’s happening in the Loop and in Chatham, in West Ridge and in Austin, at remarkably similar rates across very different communities.
What the data cannot tell us is how many of those organizations will still be operating in five years.
That part is up to the founders — and the resources available to them.
Data Sources
IRS Exempt Organizations Business Master File (eo_il.csv, November 2025 update), available at irs.gov/pub/irs-soi/eo_il.csv. U.S. Census Bureau American Community Survey 5-Year Estimates 2020–2024, Tables DP03 (Income) and DP05 (Demographics). Formation counts reflect IRS ruling year. Analysis conducted February 2026.
Additional Sources
Candid, The State of Diversity in the U.S. Nonprofit Sector (2024), candid.org. Zippia, Non Profit Director Demographics and Statistics (2025), zippia.com. Echoing Green and The Bridgespan Group, Racial Equity and Philanthropy: Disparities in Funding for Leaders of Color (2020), ssir.org/articles/entry/overcoming_the_racial_bias_in_philanthropic_funding.